colnames(data)
#>  [1] "KENNZIFFER" "EINHEIT"    "2000"       "2001"       "2003"
#>  [6] "2005"       "2006"       "2007"       "2008"       "2009"
#> [11] "2010"       "2011"       "2012"       "2013"       "2014"
#> [16] "2015"       "2016"       "2017"       "2018"       "2019"
#> [21] "2020"       "2021"       "2022"
data$KENNZIFFER
#>  [1] "Haushalte insgesamt"            "1-Personen-Haushalte"
#>  [3] "2-Personen-Haushalte"           "3-Personen-Haushalte"
#>  [5] "4- und Mehr-Personen-Haushalte" "Haushalte insgesamt"
#>  [7] "1-Personen-Haushalte"           "2-Personen-Haushalte"
#>  [9] "3-Personen-Haushalte"           "4- und Mehr-Personen-Haushalte"
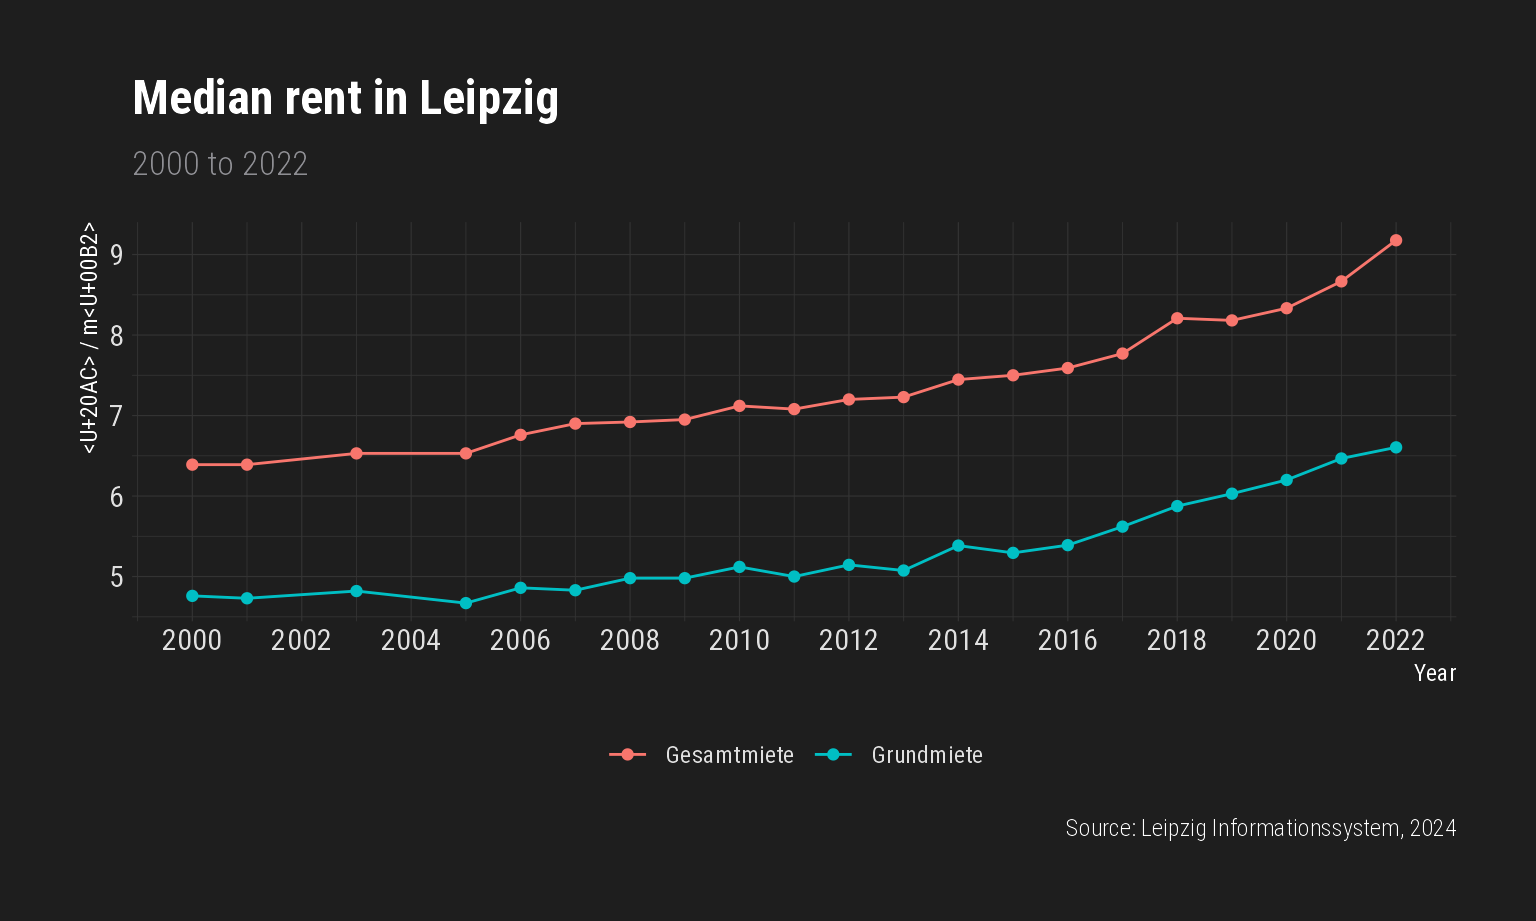
data.sub <- data %>%
  filter(KENNZIFFER == "Haushalte insgesamt")
ggplot(data.sub, aes(
  x = Year,
  y = Rent,
  colour = MIETE,
  group = MIETE
)) +
  geom_line() +
  geom_point() +
  scale_x_continuous(breaks = seq(2000, 2024, 2)) +
  scale_y_continuous(breaks = seq(4, 9, 1)) +
  hrbrthemes::theme_modern_rc() +
  theme(legend.position = "bottom") +
  labs(
    colour = NULL,
    y = "<U+20AC> / m<U+00B2>",
    title = "Median rent in Leipzig",
    subtitle = "2000 to 2022",
    caption = "Source: Leipzig Informationssystem, 2024"
  )

