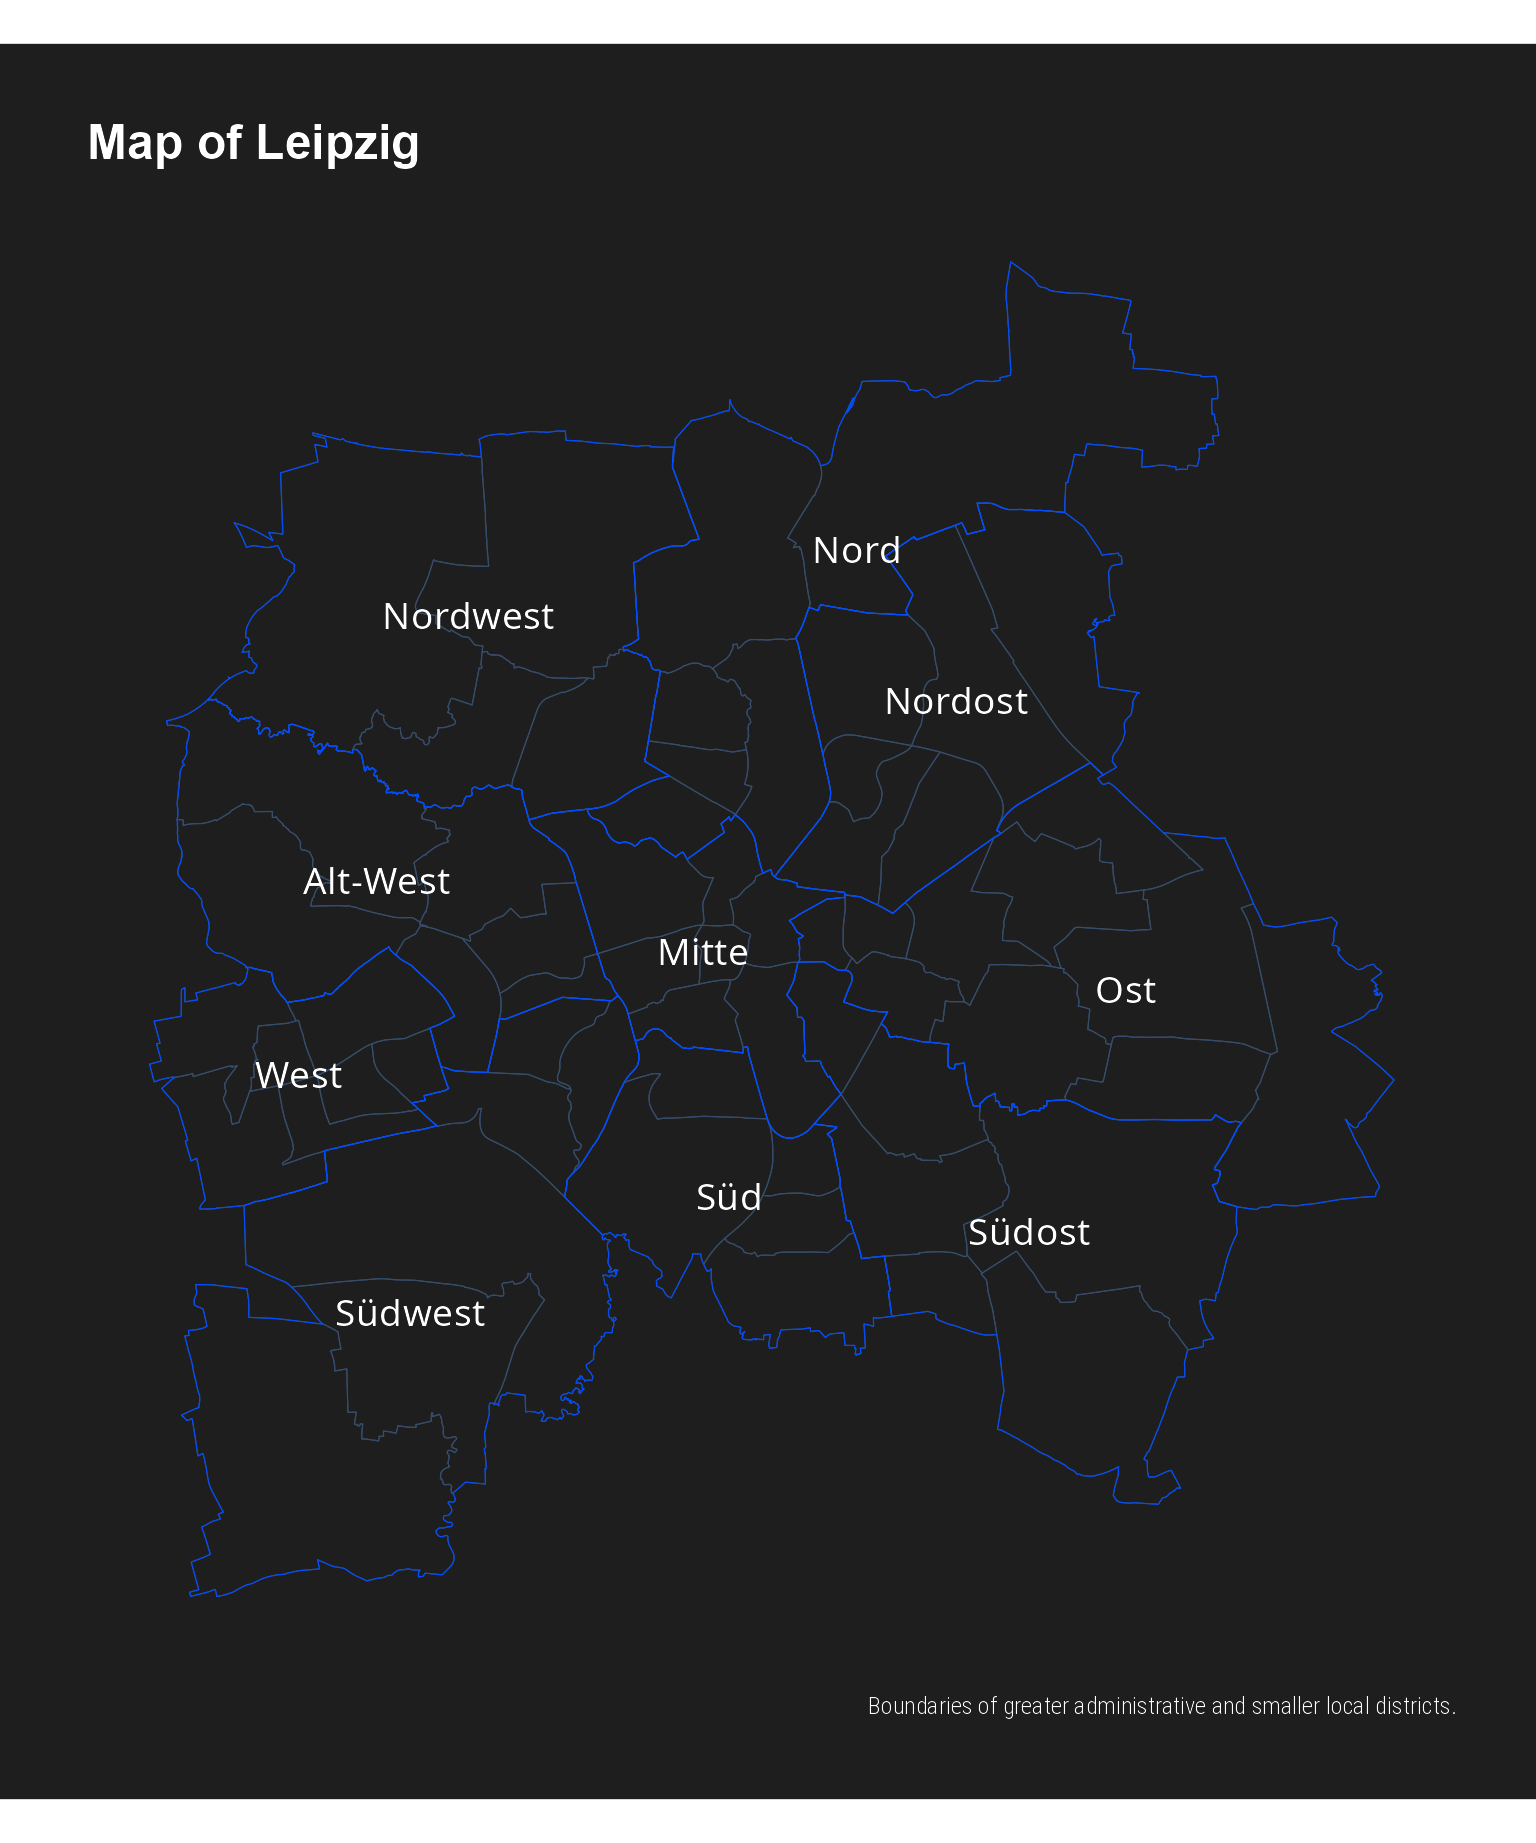
df.BZ <- get_lis_shapefile(shape = "Bezirke")
#> Reading layer `sbz' from data source `/tmp/RtmpHCYtAB/file3b4e204a62a9/sbz.shp' using driver `ESRI Shapefile'
#> Simple feature collection with 10 features and 2 fields
#> Geometry type: POLYGON
#> Dimension:     XY
#> Bounding box:  xmin: 307450.2 ymin: 5679890 xmax: 328773.4 ymax: 5702756
#> Projected CRS: ETRS89 / UTM zone 33N
df.OT <- get_lis_shapefile(shape = "Ortsteile")
#> Reading layer `ot' from data source `/tmp/RtmpHCYtAB/file3b4e1173f2fa/ot.shp' using driver `ESRI Shapefile'
#> Simple feature collection with 63 features and 2 fields
#> Geometry type: POLYGON
#> Dimension:     XY
#> Bounding box:  xmin: 307450.2 ymin: 5679890 xmax: 328773.4 ymax: 5702756
#> Projected CRS: ETRS89 / UTM zone 33N
bezirke <- cbind(df.BZ, st_coordinates(st_centroid(df.BZ)))

ggplot() +
  geom_sf(data = df.OT, color = "#354C6A", fill = NA) +
  geom_sf(data = df.BZ, color = "#004CFF", fill = NA) +
  geom_text(data = bezirke, aes(X, Y, label = Name), size = 5, color = "white") +
  hrbrthemes::theme_modern_rc(base_family = "Arial") +
  theme(
    panel.grid.major = element_blank(),
    panel.grid.minor = element_blank(),
    axis.text.x = element_blank(),
    axis.text.y = element_blank()
  ) +
  labs(
    title = "Map of Leipzig",
    x = NULL,
    y = NULL,
    caption = "Boundaries of greater administrative and smaller local districts."
  )

